
Water-Table Depth in Soil Surveys: What Representative Estimates Mean
Learn how USDA records estimate annual minimum water-table depth indicators and understand the difference between perched saturation and deep groundwater.
Water-table estimates in soil surveys indicate how close to the surface ground pores become saturated during wet seasonal months.
Visualizing Perched & Groundwater Accumulation
This three-stage visual sequence illustrates rainfall infiltration above restrictive layers, perched water tables, and deep apparent groundwater zones.
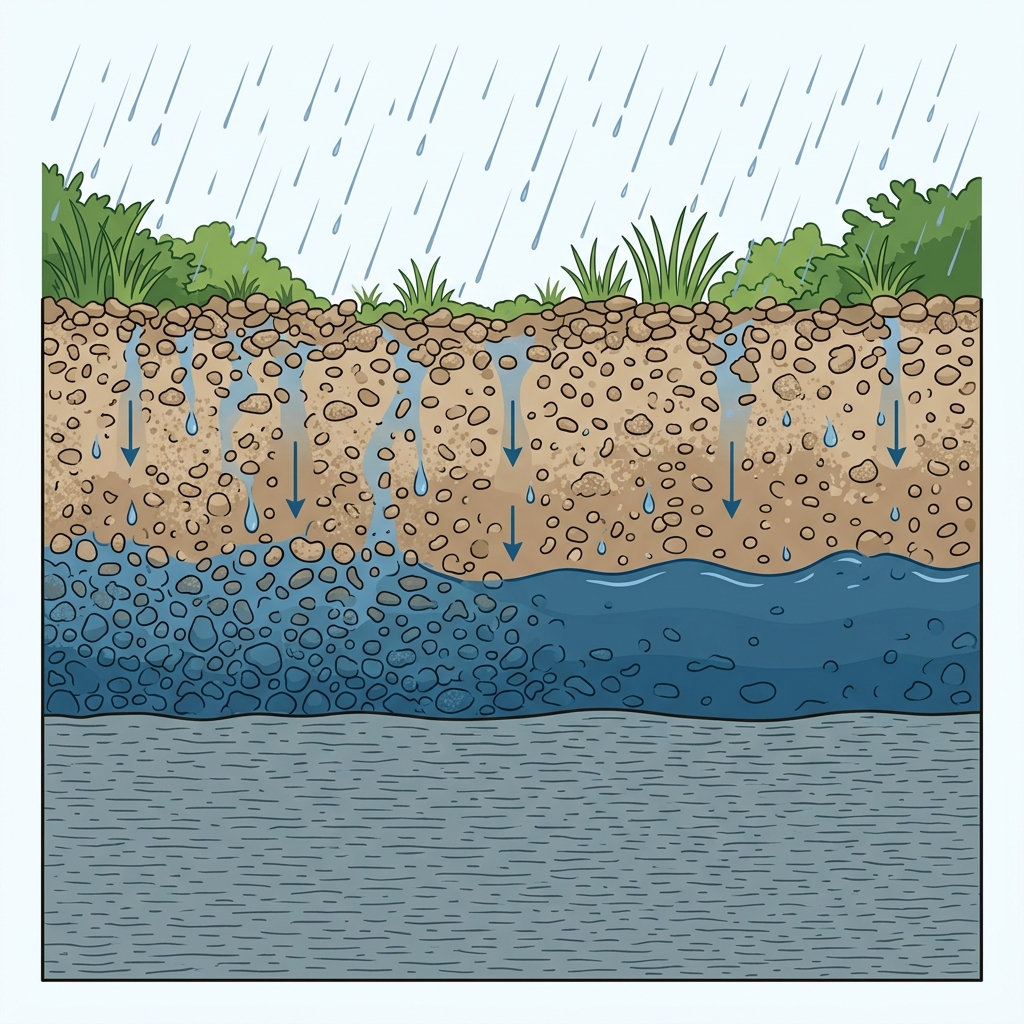
Water Intercepts Restrictive Subsoil
Rainwater percolates through permeable upper soil until encountering a dense claypan or hardpan layer, where downward movement slows.
What to notice: Notice how water accumulates directly above the dense restrictive boundary.
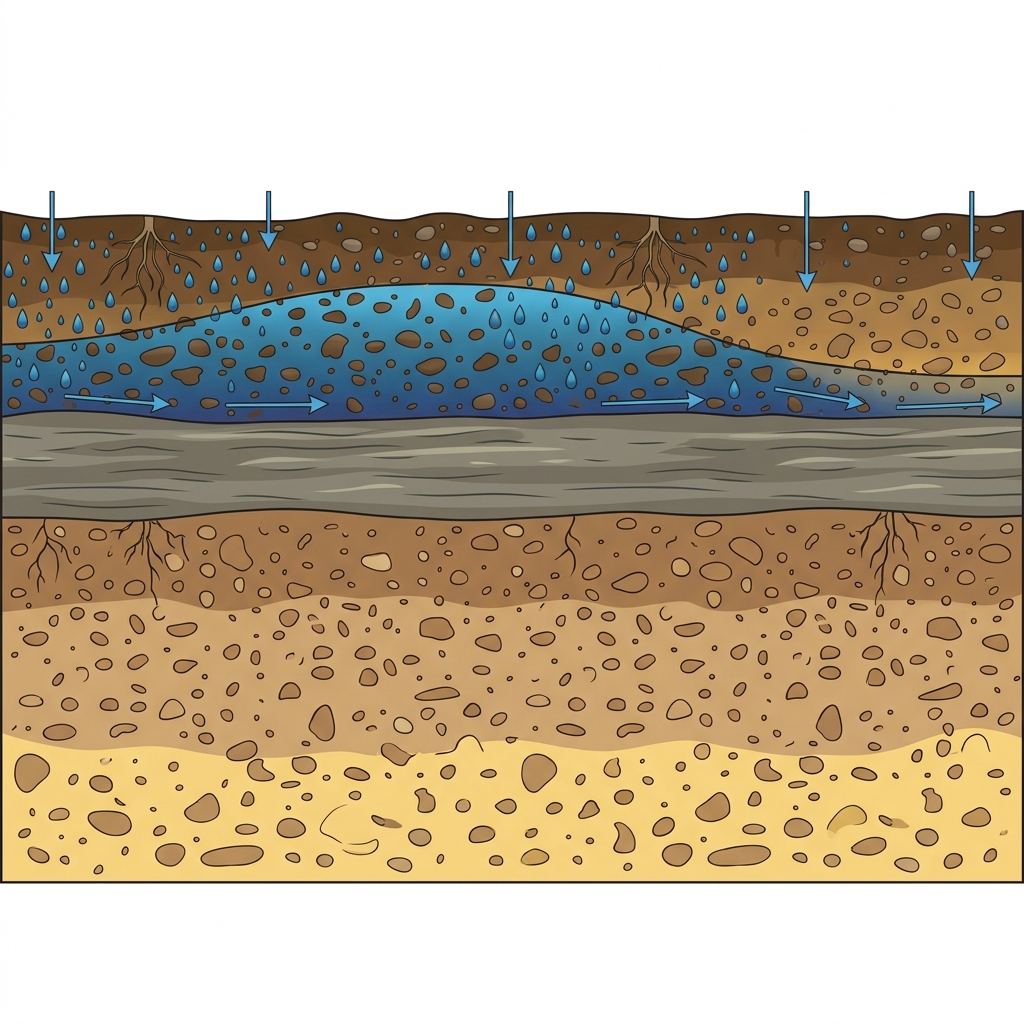
Temporary Shallow Perched Lens
A perched water table forms when a shallow lens of saturated soil rests above an impermeable layer, leaving deeper soil below unsaturated.
What to notice: The perched water lens is localized above the dense layer.
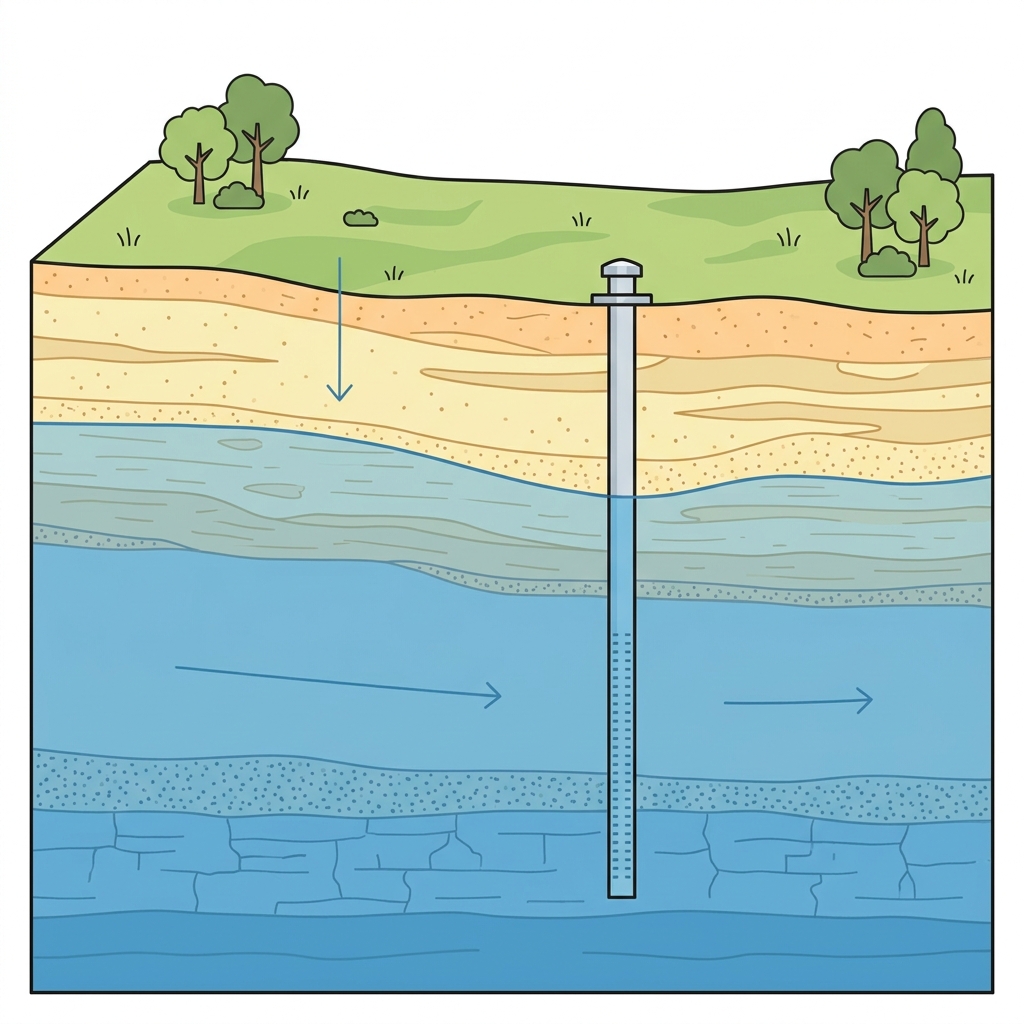
Continuous Regional Water Table
An apparent water table represents a continuous saturated groundwater zone rising from below, extending across the broader landscape.
What to notice: The saturated zone is continuous across the deeper geological profile.
Key Takeaways
- Soil survey water tables describe seasonal high saturation, not real-time address groundwater measurements.
- Perched water tables rest on shallow clay or hardpans above unsaturated deeper layers.
- Apparent water tables represent regional groundwater zones.
Understanding Mapped Water-Table Estimates
Soil survey water-table values are historical estimates of shallowest seasonal saturation.
When reviewing USDA records, water-table metrics indicate seasonal saturation indicators observed during soil mapping.
A soil-survey water-table depth is a historical survey estimate across a mapped unit, not a measurement taken at your exact searched address today.
Official USDA Field Explanation: Water-Table Depth
Water-Table Representative Depth
1. What is it? (Plain English)
The shallowest depth below the surface where soil pores are estimated to be saturated during wet months.
Technical definition: The shallowest depth of a saturated zone that occurs in the soil for a specified period during the year.
2. How USDA Reports This Field
comonth.wtdepannminInterpretation Ranges & Rating Meanings
| Category / Level | Condition / Range | Physical Property Meaning |
|---|---|---|
| Very Shallow | 0 to 30 cm | High seasonal water table near the ground surface during wet months. |
| Shallow | 30 to 90 cm | Seasonal water table within typical shallow excavation depths. |
| Moderate | 90 to 150 cm | Seasonal water table beneath shallow footings but near deep basement elevations. |
| Deep | > 150 cm | Seasonal water table well below normal surface excavation depth. |
3. Why it matters for soil evaluation
Provides historical survey screening for seasonal high water table levels near deep basements or excavations.
4. What This Field Does NOT Prove (Limitations)
- Survey water-table values are historical estimates, not real-time address groundwater measurements.
- Perched water tables resting above clay layers differ from deep regional groundwater aquifers.
- Monitoring wells or test pit excavations are required to verify parcel conditions.
USDA soil survey data provides broad mapped screening information across soil polygons. Field conditions on individual building lots can vary due to past grading, excavation, or micro-topography. Always consult a licensed geotechnical engineer or soil scientist for on-site parcel decisions.
How Water Table Appears in Subsurface Atlas Records
Subsurface Atlas extracts seasonal high water table estimates from component monthly records.
Property Relevance
Screening context for basement dampness and seasonal excavation wetness.
On-site monitoring wells or test pit excavations are required to verify site conditions.
Survey Limitations & Notes
- Values represent seasonal historical survey averages across map units.
- Perched water tables over hardpans differ from regional aquifers.
Common Myths vs. Reality
A mapped seasonal indicator does not predict basement performance. Site grading, construction, drainage systems, and current groundwater conditions require separate evaluation.
Primary Sources & References
Want to see what soil layers exist under your property?
Enter any U.S. address into Subsurface Atlas to explore mapped USDA soil units, components, drainage classes, and horizon profiles.
Run Address Lookup →