
Soil pH and Available Water Capacity: Soil Reaction & Storage
Understand how soil reaction (pH) influences nutrient availability and learn what Available Water Capacity (AWC) measures.
Soil pH measures ground acidity or alkalinity, while Available Water Capacity (AWC) measures how much water soil retains for plants after excess water drains.
Visualizing Soil Reaction & Plant-Available Storage
This three-stage visual sequence illustrates root-zone mineral availability, soil field capacity, and permanent wilting point thresholds.
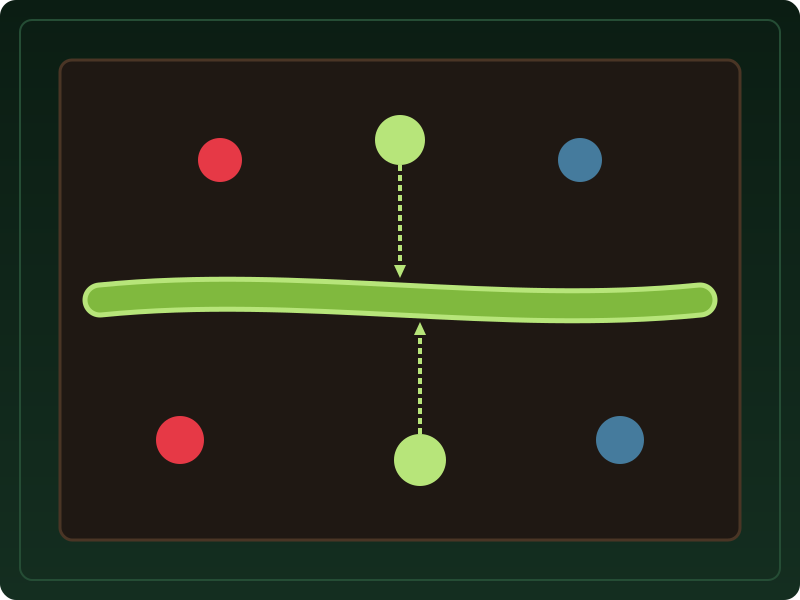
pH Influences Mineral Nutrient Solubilities
Soil reaction (pH) influences hydrogen ion activity, controlling how readily essential mineral nutrients dissolve and absorb into root hairs.
What to notice: Near-neutral pH ranges support balanced nutrient availability.

Retained Water Available for Plant Roots
After excess gravity water drains from large pores, soil reaches Field Capacity, holding plant-available water films in medium pores.
What to notice: Available water storage remains after free drainage stops.
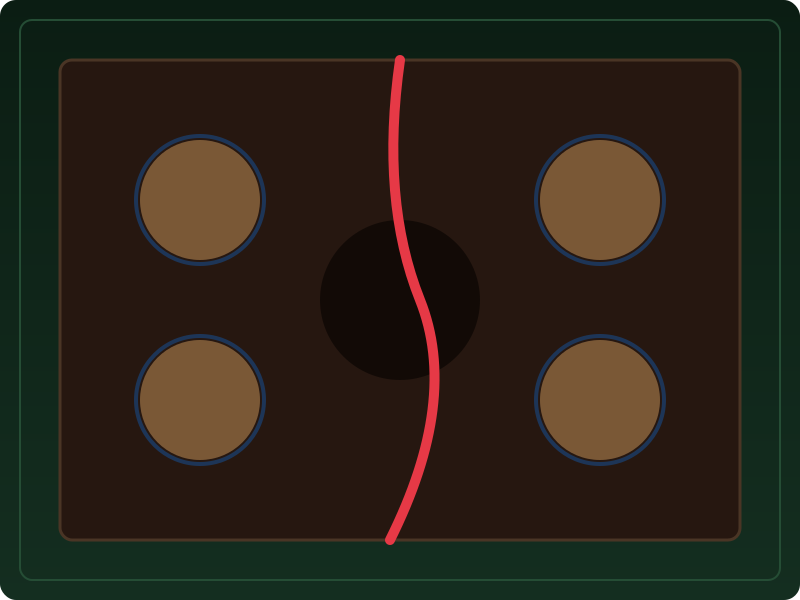
Water Held Tightly Below Wilting Point
As soil dries out, remaining water forms thin tightly held films around mineral grains that plant roots can no longer extract, reaching Wilting Point.
What to notice: AWC measures the water volume between Field Capacity and Wilting Point.
Soil pH Spectrum & Mineral Nutrient Availability
Near-neutral ranges (6.0 to 7.2) are associated with high nutrient availability for many typical crops and turfgrasses.
Soil Moisture & Available Water Capacity Spectrum
AWC represents water retained between field capacity (after free gravity drainage) and permanent wilting point.
Key Takeaways
- Soil pH measures acidity/alkalinity and controls nutrient availability.
- Near-neutral pH (6.0 – 7.2) is associated with high nutrient availability for typical crops.
- AWC measures water stored between field capacity and permanent wilting point.
Soil Reaction and Storage Capacity
pH and AWC are fundamental chemical and physical soil attributes.
Subsurface Atlas maps both soil reaction (pH) and Available Water Capacity (AWC ratio cm/cm) from official USDA SSURGO records.
AWC measures total plant-available water storage capacity. It does not report real-time address soil moisture.
Mapped Soil pH vs. Laboratory Soil Test
| Metric | USDA Mapped pH | Laboratory Soil Test |
|---|---|---|
| Data Origin | Historical natural soil survey averages | Direct chemical analysis of fresh collected sample |
| Management Action | General regional plant selection screening | Exact lime or sulfur application rates per 1,000 sq ft |
Available Water Capacity vs. Current Soil Moisture
| Concept | Available Water Capacity (AWC) | Current Soil Moisture |
|---|---|---|
| Definition | Water volume retained between field capacity and permanent wilting point | Actual water volume present in soil right now |
| Variability | Stable physical soil horizon property | Changes daily with rain, sun, and plant transpiration |
Official USDA Field Explanation: Soil pH
Soil Reaction (pH)
1. What is it? (Plain English)
A measurement of soil acidity or alkalinity.
Technical definition: The negative logarithm of the hydrogen ion activity in a 1:1 aqueous soil suspension.
2. How USDA Reports This Field
chorizon.ph1to1h2o_rInterpretation Ranges & Rating Meanings
| Category / Level | Condition / Range | Physical Property Meaning |
|---|---|---|
| Strongly Acidic | pH < 5.5 | Phosphorus and calcium availability reduced; iron and aluminum solubility increases. |
| Near-Neutral Range | pH 6.0 – 7.2 | Range associated with high nutrient availability for many typical crops and turfgrasses. |
| Alkaline | pH > 7.8 | Iron and manganese availability reduced. |
3. Why it matters for soil evaluation
Soil pH influences plant nutrient availability and mineral solubility.
4. What This Field Does NOT Prove (Limitations)
- Mapped pH represents natural survey averages; garden lime or fertilizers alter surface pH.
- Laboratory soil testing is required before applying soil amendments.
Official USDA Field Explanation: Available Water Capacity
Available Water Capacity (AWC)
1. What is it? (Plain English)
The volume of water soil can store between field capacity and permanent wilting point.
Technical definition: The volume of water that a soil can store that is available to plants, expressed as a volume fraction between field capacity and wilting point.
2. How USDA Reports This Field
chorizon.awc_r3. Why it matters for soil evaluation
Provides context for estimated plant-available water storage between precipitation events.
4. What This Field Does NOT Prove (Limitations)
- AWC is the water storage capacity between defined soil-water limits, NOT the current amount of water present today.
- AWC values vary significantly between surface topsoil and deep subsoil.
USDA soil survey data provides broad mapped screening information across soil polygons. Field conditions on individual building lots can vary due to past grading, excavation, or micro-topography. Always consult a licensed geotechnical engineer or soil scientist for on-site parcel decisions.
How pH & AWC Appear in Subsurface Atlas Records
Subsurface Atlas extracts pH and AWC across horizon layers.
Property Relevance
Screening context for garden fertility and drought resistance.
Laboratory soil testing is required before applying agricultural lime or sulfur.
Survey Limitations & Notes
- Mapped pH values represent natural survey averages.
Common Myths vs. Reality
High AWC means soil holds beneficial moisture for plants during dry spells, not that it is waterlogged.
Primary Sources & References
Want to see what soil layers exist under your property?
Enter any U.S. address into Subsurface Atlas to explore mapped USDA soil units, components, drainage classes, and horizon profiles.
Run Address Lookup →