
Map Units and Components Explained: How USDA Maps Soil Boundaries
Learn how USDA draws soil map unit polygons and understand why a single mapped polygon contains dominant soils and minor inclusions.
USDA soil maps group land into polygons called map units. Each map unit polygon contains a mix of primary component soils and minor inclusions.
Visualizing Terrain Polygons & Component Inclusions
This three-stage visual sequence illustrates soil variation across landforms, polygon mapping boundaries, and component soil mixtures.
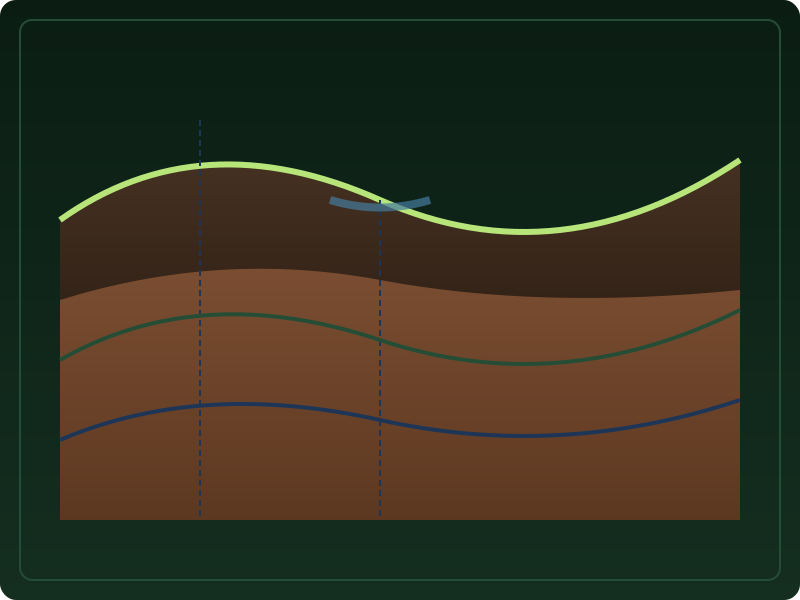
Soil Properties Vary with Landform Position
Natural soil properties change systematically across landform positions such as hilltops, side slopes, and low drainage swales.
What to notice: Soil profiles differ based on elevation and slope position.
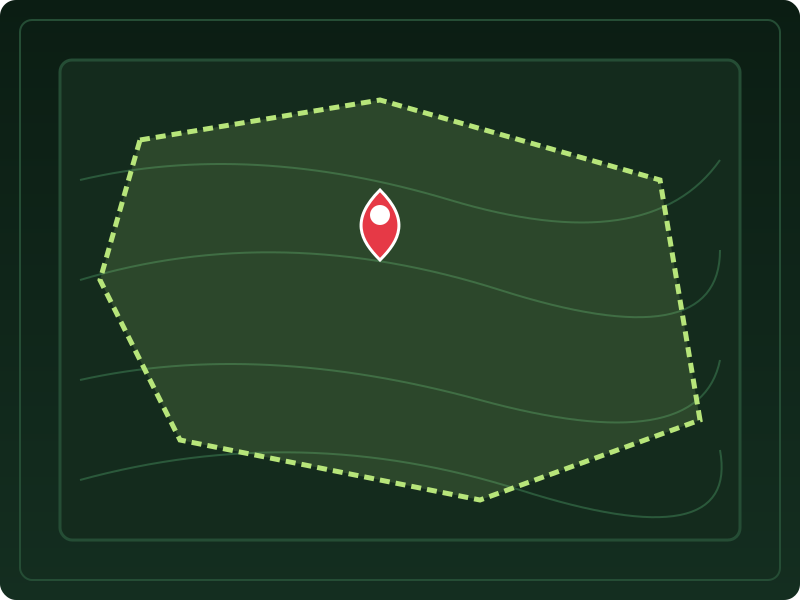
Mapping Polygons Group Related Soil Areas
USDA soil mappers draw boundary polygons called Map Units that enclose related soil landscapes and terrain patterns.
What to notice: Map unit boundaries group similar landscape positions together.
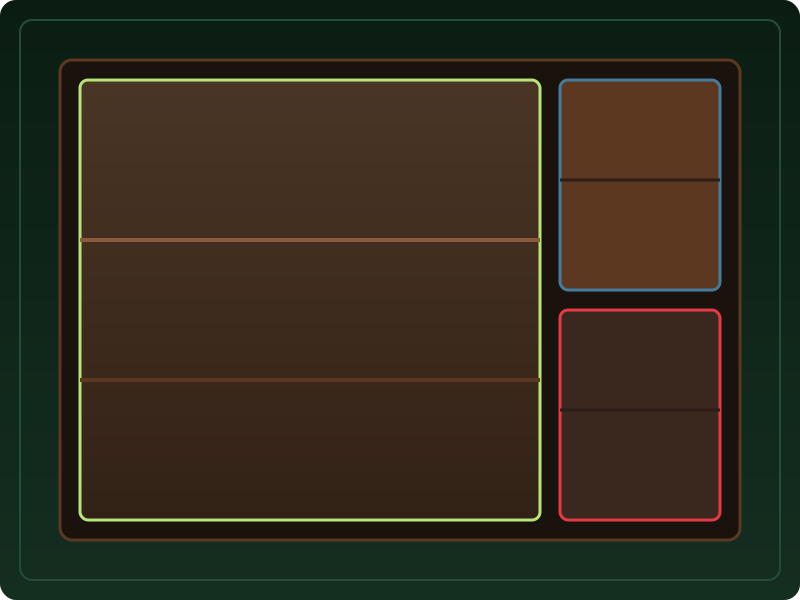
Map Units Contain Dominant Soils & Minor Inclusions
A single mapped polygon contains major component soils (e.g. 85%) along with minor inclusion soils (e.g. 15%) in low spots or ridges.
What to notice: Component percentages describe the overall polygon composition.
Map Unit Component Breakdown Example
Component percentages describe the overall mapped polygon composition across the landscape.
Key Takeaways
- A Map Unit is a mapped area polygon representing a distinct soil landscape.
- Map units contain major components (e.g. 85%) and minor inclusions (e.g. 15%).
- Component percentages describe the complete mapped polygon, not point probabilities.
Understanding Soil Survey Mapping Polygons
USDA draws polygon boundaries representing natural soil landscapes.
When searching an address in Subsurface Atlas, results query a USDA SSURGO polygon called a Map Unit.
Component percentages describe the complete mapped polygon. They do not provide point probabilities for an exact selected address point.
Official USDA Field Explanation: Map Units & Components
Map Unit Polygons & Components
1. What is it? (Plain English)
The mapped soil area boundaries and the estimated percentages of distinct soil types contained inside each polygon.
Technical definition: A map unit is a collection of soil areas enclosed by a polygon boundary, composed of one or more major components and minor inclusions.
2. How USDA Reports This Field
mapunit.muname3. Why it matters for soil evaluation
Explains why a single mapped property polygon contains a blend of primary soil types rather than 100% uniform ground.
4. What This Field Does NOT Prove (Limitations)
- Component percentages describe the overall mapped polygon, not the exact probability at a single selected point.
- Survey mapping scale (typically 1:12,000 to 1:24,000) cannot capture micro-variations under individual building footprints.
USDA soil survey data provides broad mapped screening information across soil polygons. Field conditions on individual building lots can vary due to past grading, excavation, or micro-topography. Always consult a licensed geotechnical engineer or soil scientist for on-site parcel decisions.
How Map Units Appear in Subsurface Atlas Records
Subsurface Atlas displays the dominant soil component and details all listed minor inclusions.
Property Relevance
Screening context for regional soil landscape composition across your property area.
On-site soil scientist mapping is required to establish exact boundary lines on individual building lots.
Survey Limitations & Notes
- Mapping scale (typically 1:12,000 to 1:24,000) cannot capture micro-variations under individual building footprints.
Common Myths vs. Reality
Map units contain minor inclusions that can differ in drainage or bedrock depth.
Primary Sources & References
Want to see what soil layers exist under your property?
Enter any U.S. address into Subsurface Atlas to explore mapped USDA soil units, components, drainage classes, and horizon profiles.
Run Address Lookup →